Category: Sales (23)

February/2015 
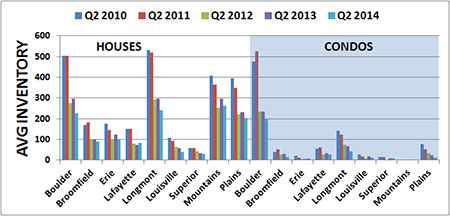
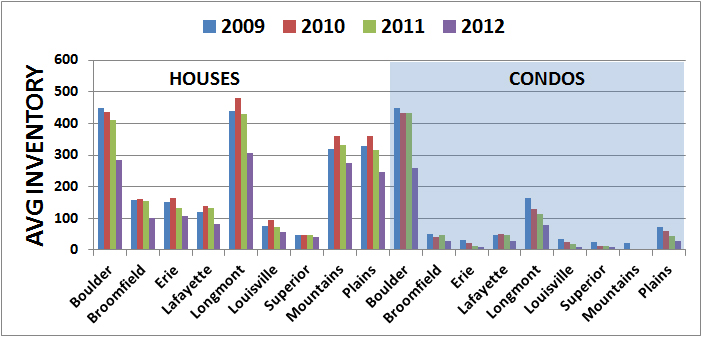
At the end of December/2011, there were 1,121 single-family home listings available for sale across Boulder County. That number shrank to 814 at the end of December/2012; 679 at the end of December/2013; and 678 at the end of December/2014. Thus we begin our fourth year of a listing drought in Boulder County. There are pluses and minuses to the impact of a reduction in available housing inventory. On the plus side, scarcity creates demand, which in turn results in an increase in home values. Builders sense buyer pent-up demand and churn up ground for new homes, characterized by small lots and populated by pocket parks strewn throughout the subdivision. On the minus side, buyers often find themselves in a position where they can neither dictate a strong negotiating position nor dally in making a decision, as other buyers may come swooping in. To the victor belong the spoils, with the spoils meaning goods or benefit taken from the loser in a competitive situation. 
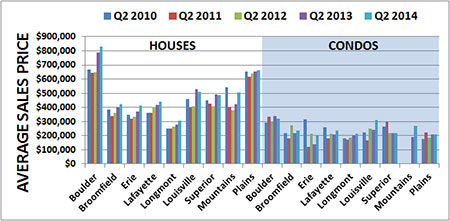
From a pricing perspective, homes at an entry to mid-range price point sell the quickest, simply because there are more buyers in those price ranges. These buyers occupy three different levels of interest: (1) Entry Level (first-time buyers); (2) Move Up (buyers who need more room; normally due to a growing family); (3) Move Down (buyers who need less space; normally due to a dwindling family; the empty nester syndrome). 
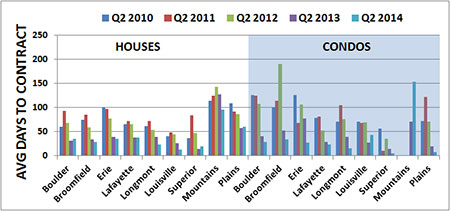
As the housing price point increases, the number of prospective buyers decreases. For Boulder County, an example of this is homes priced at a million dollars and up. At the end of December/2014 there were 141 active single family home listings on the market for sale priced at a million dollars and up. There were 245 single family homes sold in Boulder County in 2014 priced at a million dollars and up. That resulted in an Absorption Rate of approximately 149 days or slightly less than five months. The Absorption Rate in 2014 for homes priced under a million dollars in Boulder County was 65 days. (In January/2015 there were nine single family home sales priced at a million dollars and up. There are 141 active single family home listings in that price range. The resulting Absorption Rate is 554 days.) 2015 promises to look a lot like 2014. Available inventory for Boulder County will continue to expand as the waning days of winter give way to spring. At the end of January/2015 there were 700 active single family homes for sale in Boulder County; up slightly from the 678 active listings at the end of 2014. 
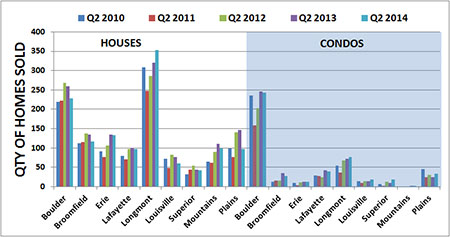
Home values will continue to increase, but are projected to rise more slowly. According to Forbes, nationally prices are near their spring 2005 levels. For Boulder County, 2005 was when the real estate market peaked. There were 4,193 single family home sales in 2005 (3,251 single family home sales in 2014) and 1,602 attached unit sales in 2005 (1,391 attached unit sales in 2014). New home construction continues to flourish across east Boulder County - Erie in particular, with in-fill construction going on in Boulder and pocket areas of Superior, Louisville, and Lafayette. Despite the increase in overall inventory, the vacancy rate for rental properties in Boulder County is around 3.3% (Apartment Association of Metro Denver). Look for rental rates to continue to increase in 2015.

 FOR ADDITIONAL INFORMATION, CLICK HERE!

DunbarHardy-MarketReport0215 Property1

  Happy Summer! The heat & hustle of summer is definitely upon us here in Boulder County. Scarce inventory still is a consistent theme. New properties placed on the market can anticipate strong interest and market response in the first 1-2 weeks they are for sale, otherwise a tone of "missing the market" price-wise occurs. With limited inventory overall, sales are down year over year. However, many of the deals that are getting done have had competing offers and/or strong efforts within the transaction to "hold it all together" to navigate the give & take between buyers & sellers to successfully close. A number of transactions are contracted as "coming soon" or for-sale-by-owners, and off-market properties which require a lot of hunting down inventory on my side, thus the "hustle season" as we end the 2nd quarter of the year. Lastly, with increased demand for properties, values are indeed climbing and equity is being gained for Boulder County property owners. Here is wishing you a great end of summer and 3rd quarter, as well as a sincere appreciation for referring me to anyone with any Boulder County real estate needs. Thank you! Take care out there.   -Dunbar Hardy

To download 2nd Quarter 2014 Newsletter, CLICK HERE!

AVERAGE INVENTORY

2014-avg-inventory-q2_21

Still slim pickins'! Across the board throughout all Boulder County communities and covering both detached homes & condos/townhomes, the number of properties for sale is down modestly year over year, but significantly down since 2010. In fact there are almost 50% less Boulder hems for sale this year compared to 2010 & 2011 2nd quarter. Simply said, there is less for sale throughout all of Boulder County this year. There is not an anticipation for significantly more inventory for sale over the next 2 quarters of the year, as we are now past our peak sales season and even new construction projects will not keep up with the buyer demand.

QUANTITY OF HOMES SOLD

2014-qty-sold-homes-q2_22

Less sales! Overall we are seeing a noticeable trend of less successful sales this year compared to 2013. This is largely due to simply less properties for sale and the inventory crunch than buyers not buying. Boulder-specific homes sales are down (7.7%) this year compared to last as an example of limited inventory (1,227 sold 2014 vs. 1,329 sold in 2013).

AVERAGE DAYS TO CONTRACT

2014-avg-days-q2_23

Hustlin'! With such limited inventory, the speed of the market has maintained a fast pace with low days on market. Boulder condos/townhomes have actually outpaced Boulder houses overall. While Louisville and Superior houses have outpaced Boulder houses also. Overall all properties are experiencing less days on market this year compared to 2011 & 2012. It is also worth noting that 2nd quarter is indeed the "peak selling season" so properties do move fastest this time of year throughout all market areas.

AVERAGE SALES PRICE

2014-avg-sales-price-q2_24

Prices are climbing! There is a noticeable upward trend in average sold prices across Boulder County community homes sales specifically, with less so of an upward trend (maintaining value) in condo/townhome sales. Boulder houses averaged $800,000+ in sold prices for the 2nd quarter 2014. while condos/townhomes averaged $300,000+ in sold prices. Buyer demand, with limited inventory is driving these prices upward and we can continue to anticipate increases in average sold prices.

MEDIAN SALES PRICE

2014-med-sales-price-q2_25

Noticeable appreciation & equity gains! Every single Boulder County community has seen increases in median sold prices of homes in the 2nd quarter of 2014 vs. 2013 and definitely since 2010. Boulder-specific homes median sold price is now $700,000.There is also a sharp increase in Lafayette-specific home values as well compared to 2013. While Boulder County condos/townhomes sold median values have largely maintained values this year compared to 2013, with Louisville condos/townhomes seeing the biggest increase in values.

Well, the most recent stats are in showing what we are feeling - a fast-paced & busy sales season throughout Boulder County! In reviewing May 2013 Year-to-Date (YTD) sales statistics, it shows that the average days on market (DOM) specifically for Boulder homes has decreased 33% ( May 2012 @88 DOM YTD vs. May 2013 @59 DOM YTD). While Boulder homes median sales price has increased 4.5% (May 2012 YTD @$564,812 vs. May 2013 YTD $590,000). The most telling statistic, however, is the 19.5% increase in the number of Boulder homes sold (May 2012 @678 YTD vs. May 2013 @810 YTD).  To download May 2013 Boulder County sales statistics: May2013stats
Happy New Year! I hope that this New Year has started off well for you. In trying to catch up with the speed of the real estate market already this year, it is worth clarifying exactly what happened in 2012… In summary, throughout all of Boulder County more properties sold in 2012 vs. 2011. Properties sold faster, less inventory was for sale, and median property values saw noticeable increases. Professionally, my own Sold sales volume increased ~71% from year-end 2011 vs. 2012! It was a good year, with very positive momentum as we now charge ahead into 2013. Right now the major theme in the Boulder County real estate market is VERY limited inventory/properties for sale. Interest rates for buyers are still at historic lows, so it truly is a great time to buy. Limited supply coupled with affordability of financing means it will be a very busy or “hustley” year as we anticipate continued increases in sold values and decreased days of the market.  I sincerely appreciate the trust and confidence my clients have had in my efforts to assist in successful buying/selling of local real estate. I will continue to do all that I can to stop in front of the market statistics & property-wise, and I sincerely appreciate any referrals. Have a good beginning of 2013! 

Average Inventory

2009-2012 Avg Inventory YEAR  

Average Inventory - Slim pickins! Boulder County is experiencing ~7 year lows in available properties. This can clearly be seen in all communities and in both houses & condos/townhomes. 2012 ended with a ~27% decrease in Active properties for sale vs. year-end 2011. As we slip into the spring months and into the 2nd quarter, more will indeed be coming onto the market, but 2012 year-end statistics clearly show a steady decrease in properties for sale.

Quantity of Homes Sold

2009-2012 Qty of Homes Sold YEAR

Quantity of Homes Sold - More properties sold in 2012 vs. 2011! There are noticeable increases sold volume in all Boulder County communities. Specifically, single-family homes sold were up ~24% and condos/townhomes sold were up ~20% over Boulder County in 2012 vs. 2011. This is positive momentum as we anticipate similar to increased sales volume in 2013.

Days to Contract

2009-2012 Avg Days to Contract YEAR

Days to Contract - Faster! With limited inventory in 2012, the pace of the market picked up and the overall number of days on market noticeably decreased throughout all communities of Boulder County. Specifically the overall average days on market for 2012 year-end was 91 days vs. 156 days year-end 2011 and 189 days on market year-end 2010. In summary, this means that properties sold twice as fast in 2012 vs. 2010!

Average Sold Price

2009-2012 Avg Sold Price YEAR

Average Sold Price - Gains! 2012 also ended with slight increases in the overall average sold prices throughout all of Boulder County. As a whole the local Boulder County market expanded with a ~3.5% increase in the 2012 year-end average price of single-family homes vs. 2011 year-end. Boulder specifically had a 2012 average sold single-family home price of ~$668,000 (highest in the county) vs. Longmont average sold single-family home price of ~$245,000 (lowest in the county).

Median Sold Price

2009-2012 Median Sold Price YEAR

Median Sold Price - Here it is… The true statement of the local market value is looking at the median prices, which is at what value/price did most sales occur. It can be seen that there were overall increases in median sold prices throughout all of Boulder County for 2012 vs. 2011. Specifically in Boulder, single-family homes median sold value in 2012 was ~$585,000 vs. ~$565,000 in 2011. Equity is being gained!

Re/Max Co-Founder & CEO, Dave Liniger, offers a brief 2012 summary of the housing market and 10 predictions for the 2013 national housing market. [youtube http://www.youtube.com/watch?v=2Trbvc5-2nU&w=560&h=315]
I am pleased to announce the successful sale of this top floor condo (~880 sq ft 1bd/1ba w/loft) in Whittier Square located at 2201 Pearl Street #309 - literally in the heart of downtown Boulder. I represented the seller in this transaction and was also able to secure a buyer for the property. After ~1 week of negotiating, we were under contract with an agreed offer to purchase in ~10 days on the market and successful closed with a local lender providing financing. Small world story on this transaction, the buyer literally used to own a unit directly underneath this top-floor unit ~10 years ago and is now re-locating back to Boulder from back East, ha! Final Sales Price - $247,860. 

Happy Spring Season! With the end of the 1st Quarter of 2012 already behind us, the market is literally taking off and roaring into the Summer Season! Gathering 2012 1st Quarter Sales Statistics, I have been able to put together a 4-year 1st Quarter (2009 - 2012) comparison to show "how's our market doing" right now. Buckle up, as we could be in for a BIG 2012!
In summary, sales are noticeably increased in the 1st Quarter (compared to 2011) throughout all of Boulder County, with Boulder and Longmont Sold homes specifically seeing 4-year highs. This increase in Solds is coupled with a 4-year low in the amount of available properties for sale in some markets within Boulder County. This dynamic has created is a bit of a "frenzy" with multiple offers on well-priced new properties placed on the market, and some properties even selling above their asking price. Boulder homes specifically saw a 4-year high in Median Sold Prices, with increases in Median Sold Prices of homes throughout almost all Boulder County communities. Buyers need to act quickly in pursuing new properties on the market. While sellers accurately pricing their homes when placing them on the market, can expect a busy 2nd Quarter of the year.
The market is busier than it has been over the last 4-years, and there is some good positive momentum going into Summer. We will see how Boulder County keeps going into the 2nd Quarter of the year…
Quantity of Homes Sold:
Sales are Up! Houses specifically in Boulder And Longmont saw 4-year highs in Solds for the 1st Quarter of 2012. There were increased homes sold in Broomfield, Lafayette, and Superior, while Boulder, Lafayette, and Superior condos/townhomes also saw an increase in Solds when compared to 1st Quarter 2011. All of these increased Sold volume in these markets throughout Boulder County are perhaps the most encouraging signs I am holding onto as we look at a "good" 2012!
Average Inventory:
Thin! That is the phrase for limited new inventory on the market throughout the 1st quarter of 2012. The 1st Quarter is historically a slow time of year for properties coming onto the market, but 2012 saw a 4-year low in terms of available homes for sale throughout all of Boulder County. The most significant declines in available inventory were houses specifically in Boulder and Longmont along with condos/townhomes in Boulder. This limited supply has created a demand in these specific markets as we now go into the 2nd Quarter of 2012.
Days to Contract:
The 1st Quarter of the year typically has slower traffic, as there are more buyers shopping for homes in the later Spring/Summer months, so 1st Quarter Days on Market typically are longer than most other quarters of the year. Of the homes that did sell in the 1st Quarter 2012, there were actual decreases in the Days on Market in for homes in Broomfield, Erie, Lafayette, and Superior along with condos/townhomes in Erie, Lafayette, Longmont, Louisville, and Superior when compared to 2011. There were increased Days on Market specifically for Boulder homes and condos/townhomes, as well as Broomfield condos/townhomes.
Average Sold Price:
Boulder proper specifically holds its place as the highest real estate values throughout Boulder County, followed by the Plains, which is considered to be larger properties/acreage of ranches and/or some unincorporated parts of the county. There was a ever-so slight decrease in the Average Sold Price of Boulder homes for the 1st Quarter of Solds in 2012, while there was a slight increase in the Average Sold Prices of Boulder condos/townhomes. Overall there were flat to slight increases in Average Sold Prices were seen in homes in Broomfield, Erie, Lafayette, Longmont, Louisville, and even in the Mountains for the 1st Quarter 2012.
Median Sold Price:
One of statistics out of the 1st Quarter Solds in 2012 that caused pause, was a very notable 4-year high in the Median Sold Prices of Boulder homes to $600,000+. This was pushed upward because of some discounted upper-end homes finally finding buyers and getting some great-valued large deals done. Boulder was not alone in this increase in Median Sold Prices, as homes in Broomfield, Erie, Lafayette, and Louisville also saw notable increases. In the condo/townhome world, there were slight increases (when compared to 2011) in Median Sold Prices specifically within Boulder, Lafayette, and Longmont markets.
I am pleased to announce the successful sale of 4542 Sprucedale Place located in the new Northfield Village of North Boulder. This brand new home featured 3bd/2.5ba ~2,400 finished sq ft with a main level master bedroom and an attached 2-car garage. Built by Coast to Coast Development, this Energy-Star rated home featured a high-efficiency furnace, double pane low E-glass windows throughout, low VOC paint, water-based hardwood floors, and blown-in insulation. The home came in with a 56 HERS rating (Home Energy Rating System). This home and its features will be a perfect fit for my clients who were looking for a low maintenance, easy floor lag, lock & leave type property plus they received a 1-year builder's warranty! Final Sales price was $679,000.

I am pleased to announce that I recently sold a lovely Neo-Victorian home located on the West End of Downtown Boulder at 2060 5th Street. This 5,300+ square foot home was built in 2003 and featured 6bd/5bath, pine hardwood floors, slab granite countertops, walk-out basement with a sauna, and a detached 2-car garage.

The "word-of-mouth" local real estate network secured a successful sale before this property even was listed on the market for sale. Final Sales Price - $1,365,000. 

Happy New Year! I hope the Holiday Season went well for you. With 2011 just ending, I have been able to gather all of the year-end data, conduct a 3-year comparison (2009 – 2011), and create a very good snapshot of current market conditions as we go into 2012.

In summary, Boulder County shows signs of being a relatively “stable” market over the last 3 years in terms of values/pricing largely holding even. This is encouraging as much of the national news is “doom & gloom” with tremendous loss of value. With the overall trend of Colorado and specifically Boulder County population growing, properties are indeed selling. Properties might be taking a little bit longer to sell over the last 3 years, but again, prices/values show a steady-flat trend line.

AVERAGE INVENTORY (2009 - 2011)

We have seen a downward trend in homes for sale (less inventory) in Boulder –specifically from 2009 – 2011. In Boulder-specifically, we have had a very comparable amount of inventory between houses for sale & condos/townhomes for sale. We are also seeing an overall general trend (from 2009 – 2011) of flat/even to slightly decreased inventory of properties for sale (both homes & condos/townhomes) in every Boulder County community.


Quantity of Homes Sold (2009 - 2011)

We have seen a similar amount of home sold in Boulder in 2011 vs. 2010, with less condos/townhomes sold in this same timeframe. Ultimately, more houses have sold vs. condos/townhomes in Boulder from 2010 – 2011. We have seen slight decreases in homes sold in Broomfield, Erie, Longmont, and Superior from 2009 – 2011, and slight increases in the quantity of homes sold in Lafayette, Louisville, in the Mountains, and Plains properties. While looking specifically at the condo/townhome market, we have seen a noticeable decrease in the properties sold in Boulder, Longmont, Louisville, and Superior from 2009 – 2011, with more or less stable condo markets in Broomfield, Erie and Lafayette.


Average Days to Contract (2009 - 2011)

We can see a noticeable increase in the number of days on market (DOM) for homes over 2009 – 2011 in Boulder (~85 DOM), Lafayette (~85 DOM), Louisville (~65 DOM), and Superior (~70 DOM). The condo/townhome market overall has a noticeable trend of longer days on market vs. houses-specifically. From 2009 – 2011 there is a dramatic increase in days on market for condos/townhomes in Boulder (~150 DOM), Broomfield (~135 DOM), Lafayette (~100 DOM), and Longmont (~105 DOM).


Median Sold Price (2009 - 2011)

There is a slight increase in the home prices that have sold in Boulder- specifically from 2009 – 2011 (~$550,000), with most other communities stabilizing/even over the 3-year trend. Worth noting is a slight decrease in median home prices in Superior and in the Mountains. The median sold prices of the condo/townhome market have seen some increases in Lafayette & Superior with stable prices overall in Boulder, Broomfield, Longmont, and Louisville.

Average Sold Price (2009 - 2011)

With the potential for greater discounting on higher-end & acreage properties, we have seen a slight increasing trend in the average sold prices of homes in Boulder (~$675,000) and on the Plains (~$625,000) from 2009 – 2011, whereas all other Boulder County communities are showing a stable/flat trend-line of average sold values. Minus a decrease in Erie condos/townhomes, we are seeing a relatively stable/flat trend-line of the average sold prices of condos/townhomes throughout Boulder County.

Please contact me if you you like more specific neighborhood/location statistics, as I would be glad to support you however I can!